

GA4 LLM Traffic Dashboard
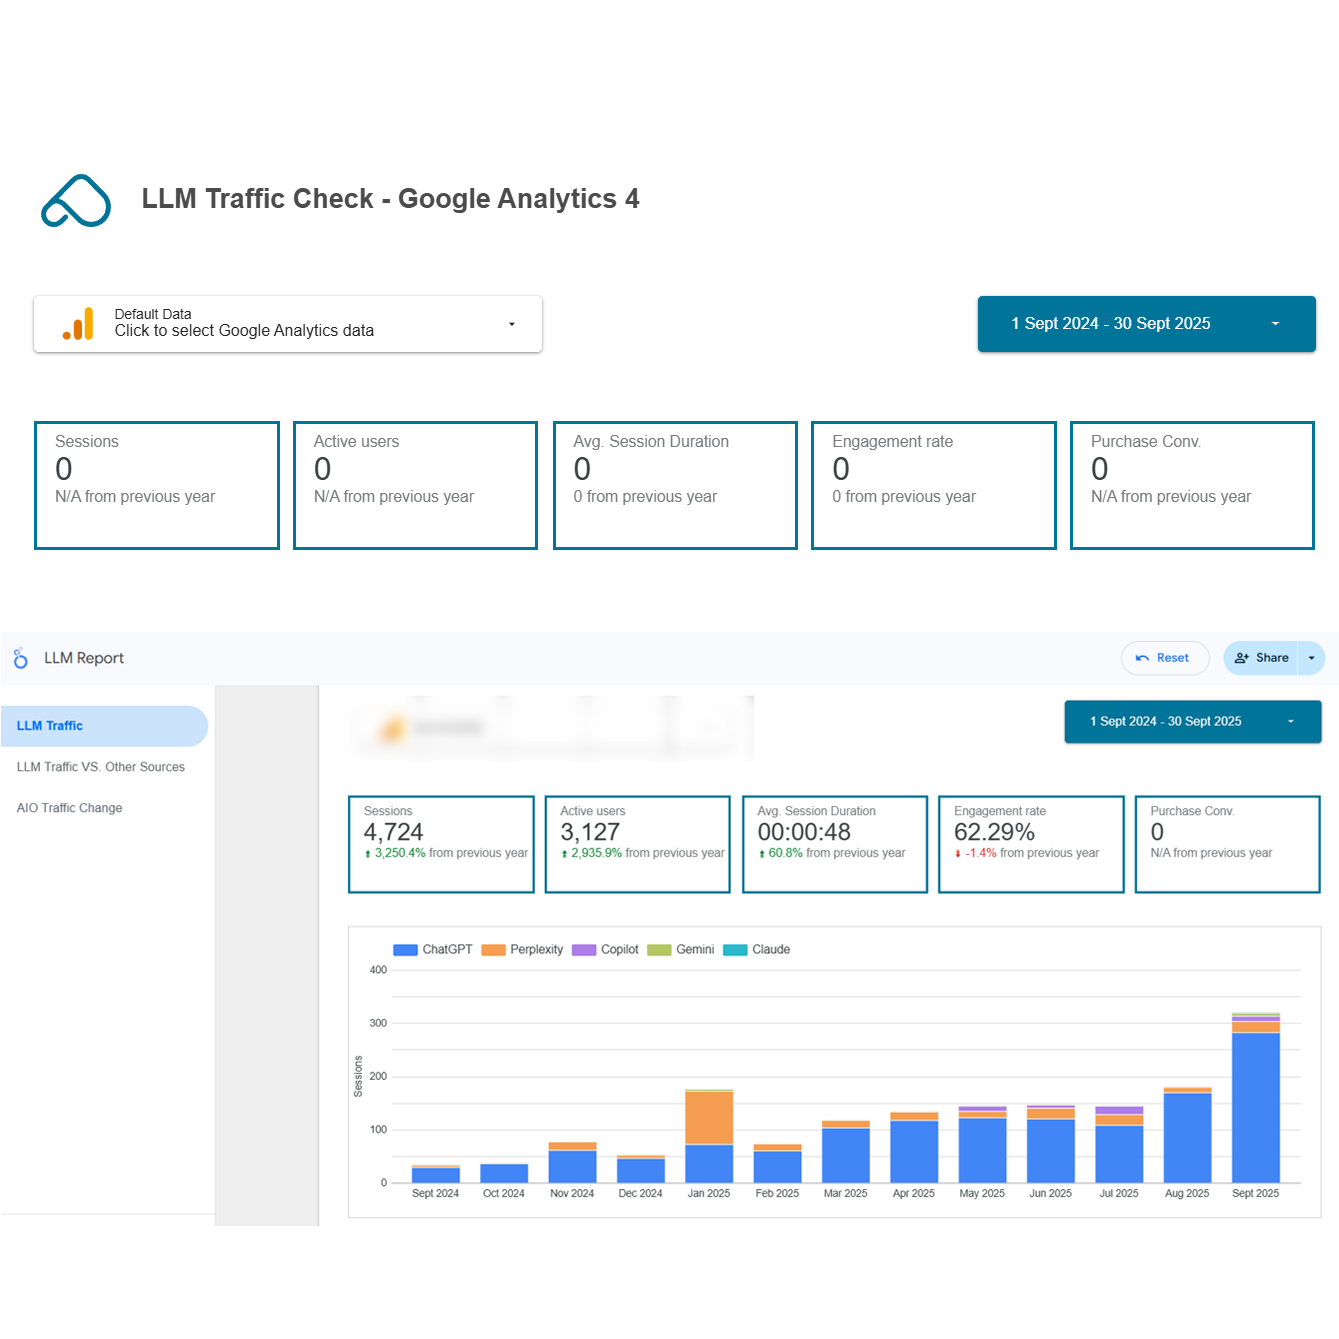
Our LLM Tracking Dashboard in Looker Studio shows whether your domain is already receiving traffic from LLMs (Large Language Models) based on your GA4 data. The dashboard is compatible with any activated GA4 property and ready to use immediately.
It provides answers to key questions:
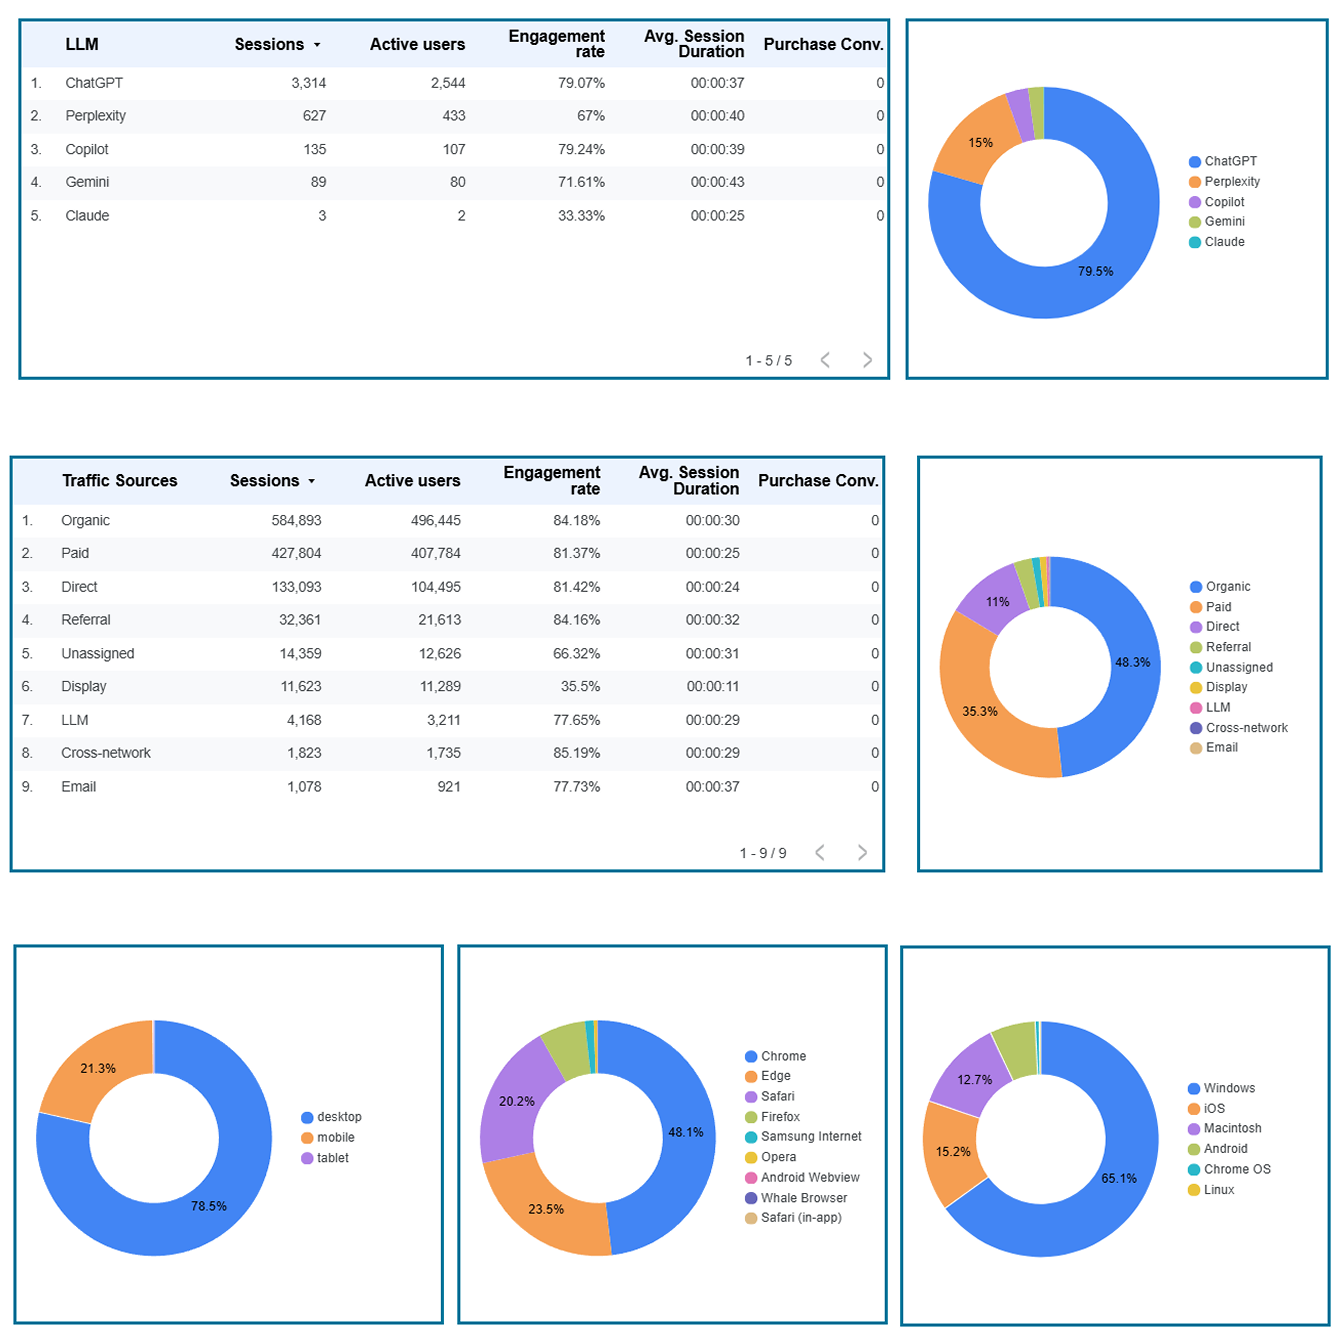
✅ Which LLMs (e.g. ChatGPT, Gemini, Perplexity) generate the most traffic to your site?
✅ How is LLM traffic developing over time on a monthly basis?
✅ How does LLM traffic compare to other sources such as SEO or Paid?
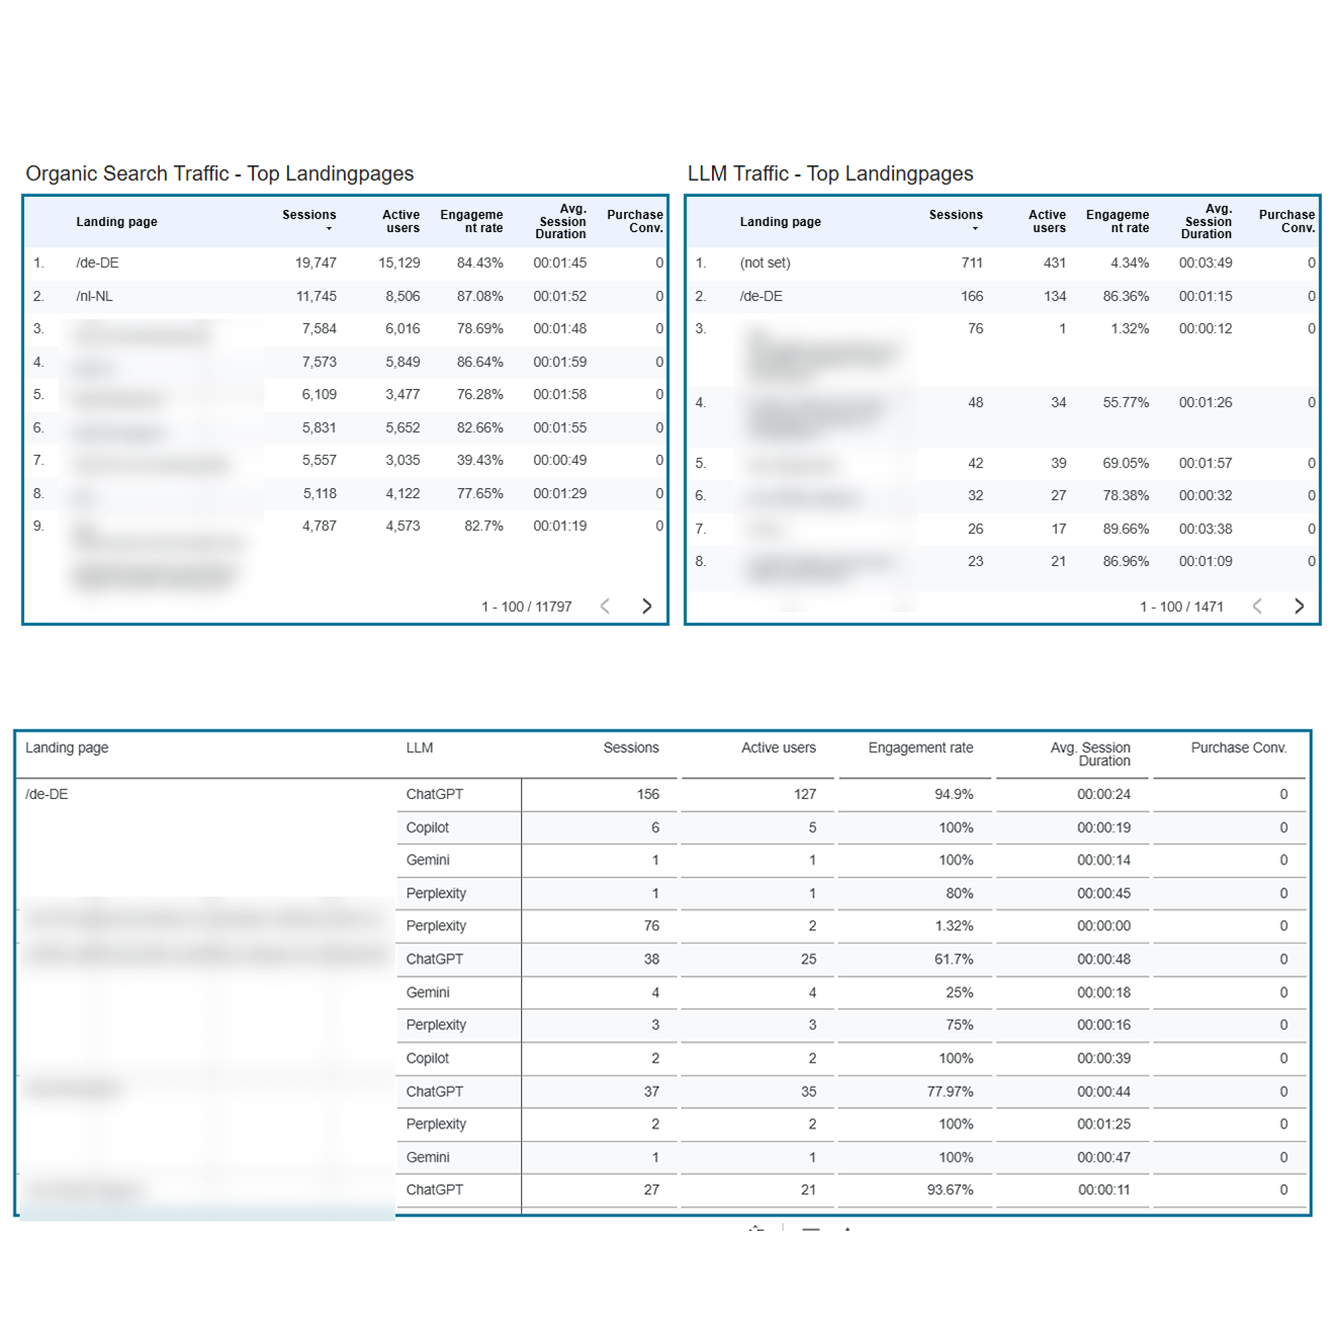
✅ Which landing pages receive LLM traffic – and through which devices, browsers, and locations do users access your site?
With the dashboard, you’ll gain a deeper understanding of your LLM audience, uncover user behaviour, and optimise your content specifically for e-commerce conversions.
Getting Started: Here’s How
When you first open the dashboard, it might appear empty – no need to worry:
- Log in using the Google account with access to your GA4 property.
- Select the relevant property via the dropdown menu.
- The initial data load may take a moment – try refreshing if needed.
- The dashboard pulls data from the past 12 months.
Once loaded, the first table provides immediate insights – showing how traffic has developed across different Large Language Models, month by month.
Detailed Traffic Insights
Pie charts reveal which Large Language Models, browsers, devices, and channels are driving the most traffic:
- Percentage breakdown of all detected LLMs
- LLM traffic distribution in relation to all channels
- Details on users’ browsers and devices
Perfect for identifying where your content is already gaining visibility – and where untapped potential lies.
LLM Traffic on Landing Pages
Which pages on your website attract the most LLM traffic?
- Clear table showing session distribution per landing page
- Insights into whether individual pages are accessed by multiple LLMs
- Identify content hubs and performance standouts
A valuable foundation for content strategy, CRO initiatives, and technical optimisation.
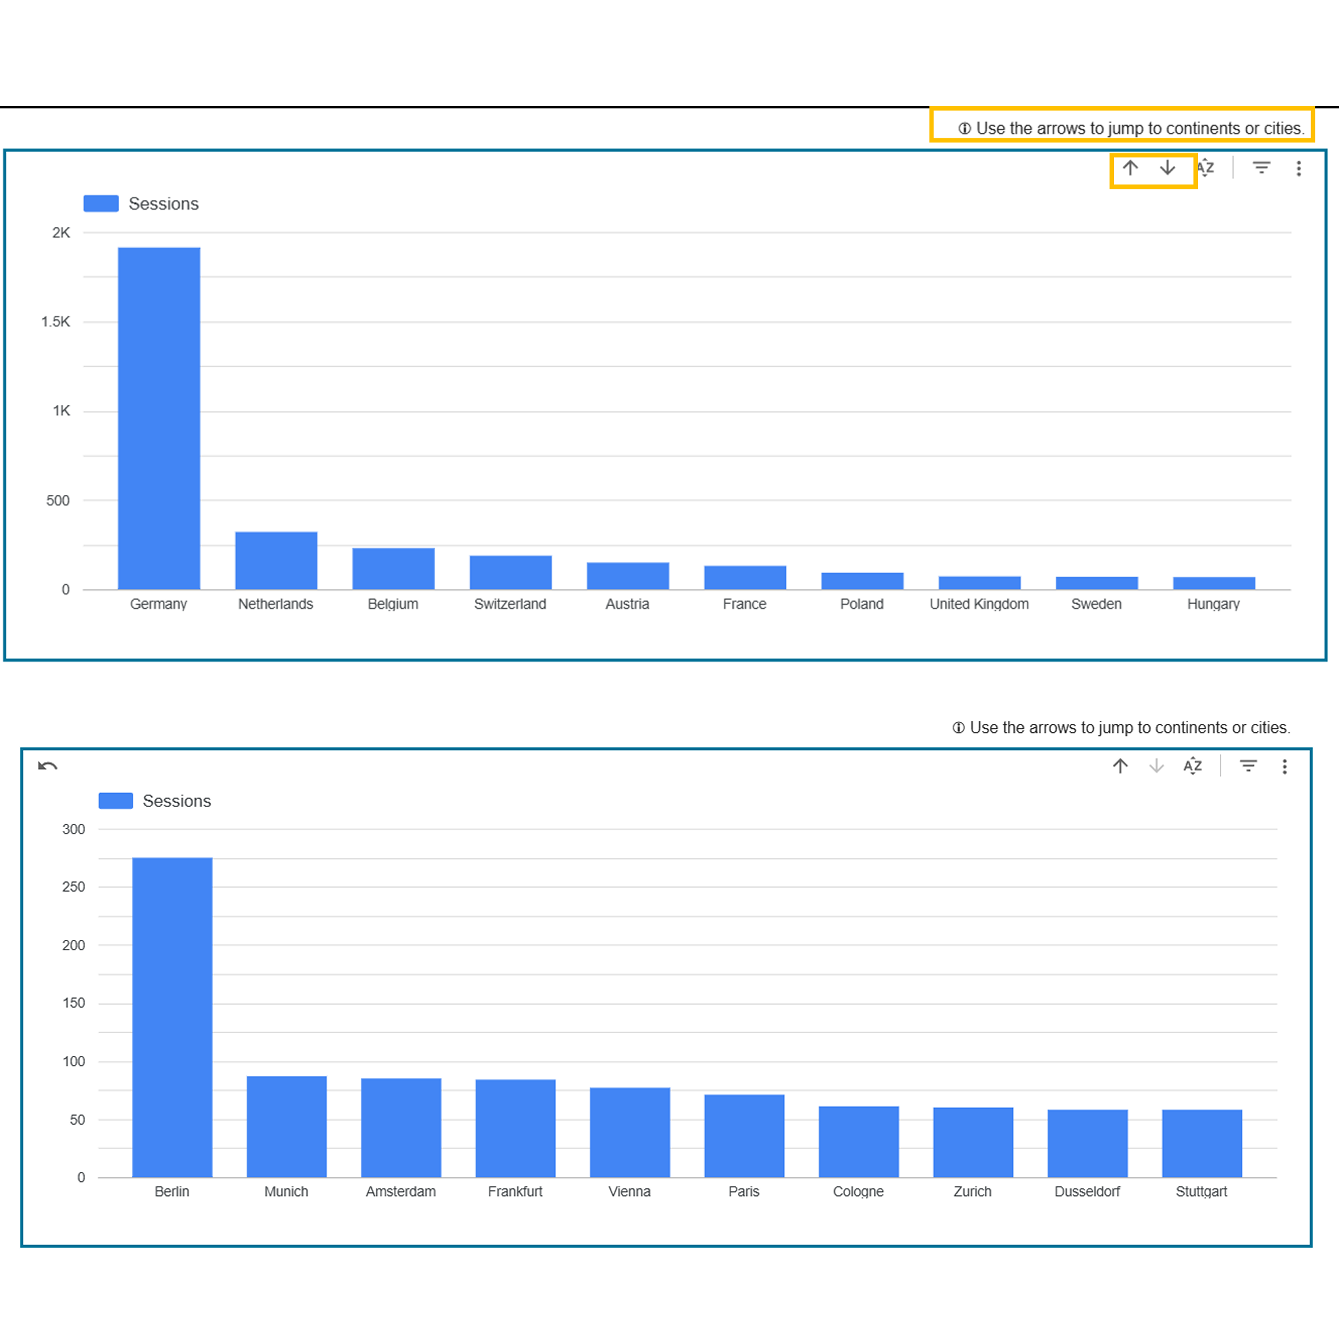
LLM Traffic by Location
Understand how – and from where – LLM users are reaching your site:
- Traffic distribution by continent, country, and city
- Visualised in bar charts, navigable via arrow controls
- Detailed insights into the geographic origins of your audience
A powerful tool for localising and fine-tuning your content strategy.
LLM Traffic in Channel Comparison
How are Google’s new AI features affecting your SEO traffic?
- Focus on AI Overviews (AIO) and their impact on your organic performance
- Comparison of organic traffic versus other sources over time
- Identify whether – and to what extent – AI Overviews have influenced your SEO results
With our Looker Studio GA4 Dashboard, you gain a complete overview of your LLM traffic, spot trends early, and optimise your landing pages with confidence – backed by data.
Try it yourself for free!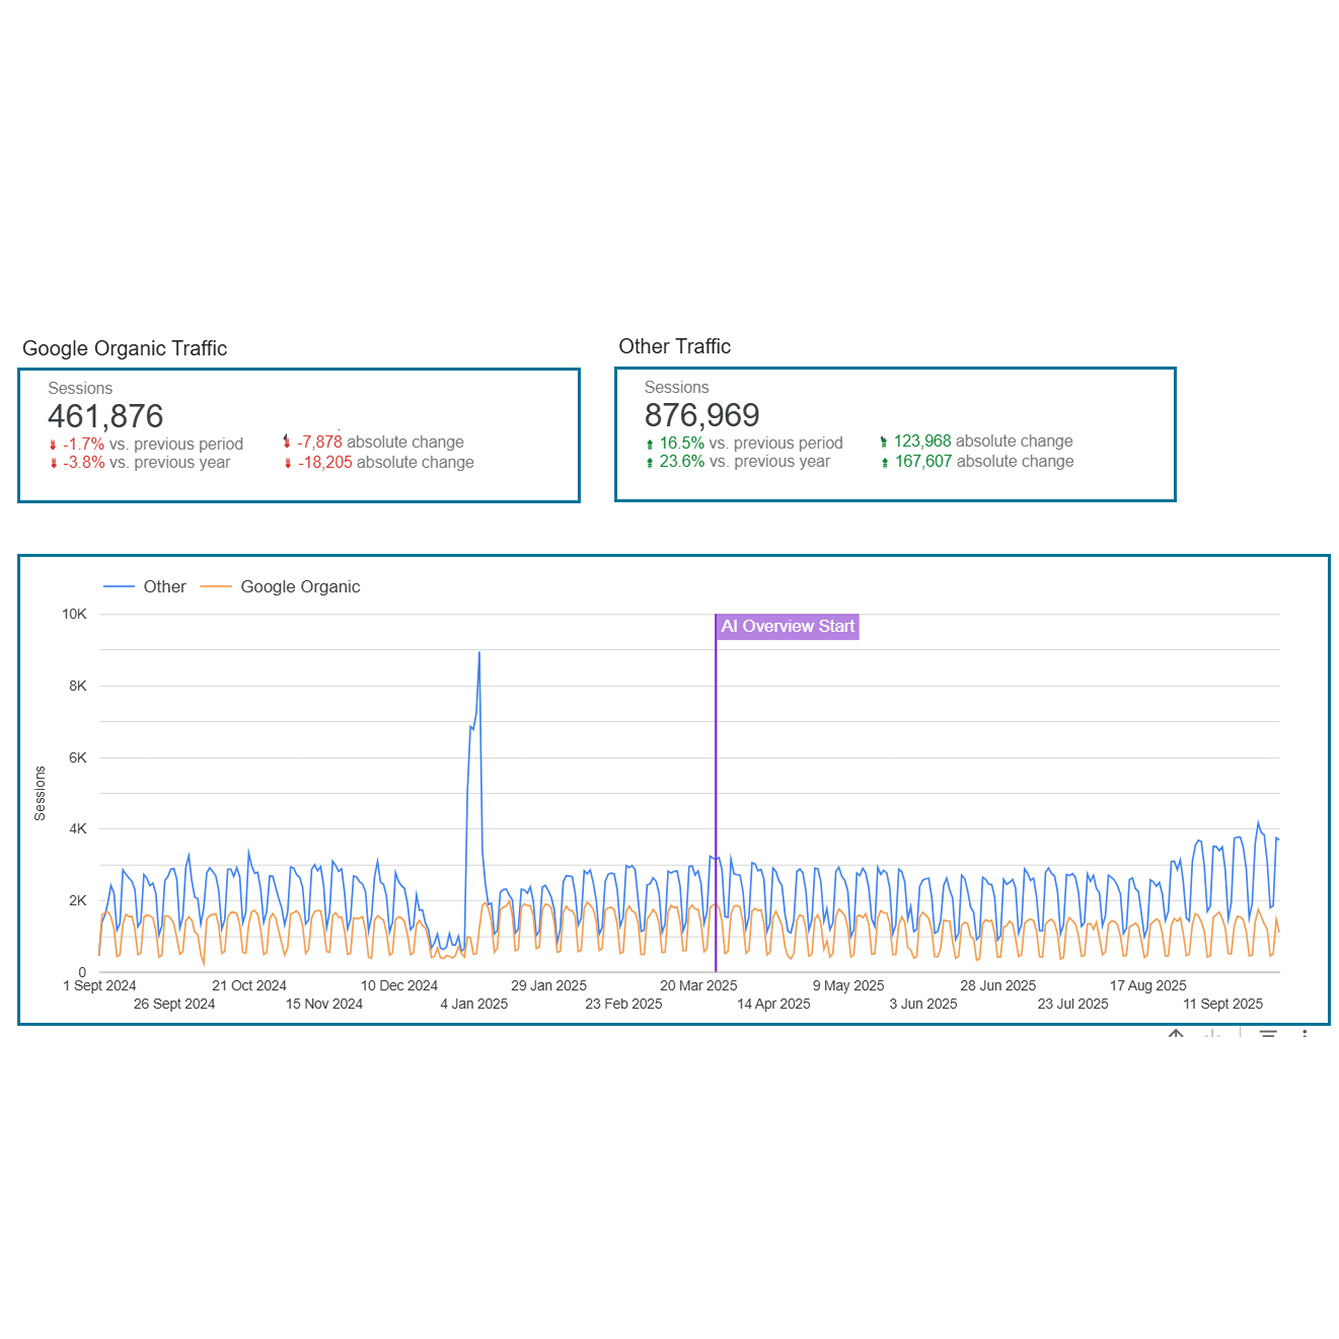
Who is the dashboard intended for?
Partnerships
In addition to our dedication and expertise, it is our trusting partnerships in the industry that allow us to reach our full and impressive potential.


